
 Picture
this: You are a junior in
high school with 6 classes a day, a part-time job, you have a boyfriend or
girlfriend and you are vice-president of the student council. Additionally, you have the demands of text
messages going off on your phone every four minutes and you really need to
sleep at some point. You walk into your
1st hour math class and your teacher casually reminds you that you have a
test, tomorrow, on an entire unit of material that was 9 sections long. You have to work tonight and have a paper due
for Government in two days! Panicking
yet? I know that I would be!
Picture
this: You are a junior in
high school with 6 classes a day, a part-time job, you have a boyfriend or
girlfriend and you are vice-president of the student council. Additionally, you have the demands of text
messages going off on your phone every four minutes and you really need to
sleep at some point. You walk into your
1st hour math class and your teacher casually reminds you that you have a
test, tomorrow, on an entire unit of material that was 9 sections long. You have to work tonight and have a paper due
for Government in two days! Panicking
yet? I know that I would be!
All hope is not lost,
however, as your teacher starts handing out a set of graphic organizers that
she made ahead of time. These handy
little sets of paper include flowcharts, tables, Venn Diagrams and other organizational
tools designed to help you summarize the most important parts of the unit. You are start to breath a (small) sigh of
relief because at least now you have a place to start and maybe, just maybe,
you can still work and study in order to pass the test!

For me, I wish graphic
organizers has been used, publicized (as I'm sure they must have existed - we
just never saw them) and/or encouraged as a study and organizational tool. I had (and still at times have) issues
retaining concepts for longer periods of time, partially because I was busy and
partially because of how my brain worked.
Given that it was 20+ years ago when I was in high school and we didn't
have the high stakes standardized testing pressures that students have today, I
probably got off easy.
As a teacher at the
secondary level, I see what my students have to deal with. It goes beyond the scenario I outlined above
to also include studying for the state testing, taking care of younger brothers
and sisters, applying for colleges and scholarships and so much more. As a result, I have spent time trying to find
a way to help my students be able to better visualize that material, the
connections between topics and to help them retain the knowledge beyond a unit
test. I want them to develop study
skills that will aid them not only in finishing high school but to also help
them succeed in college and the workforce.
I see graphic organizers as a way to do that for 4 reasons.
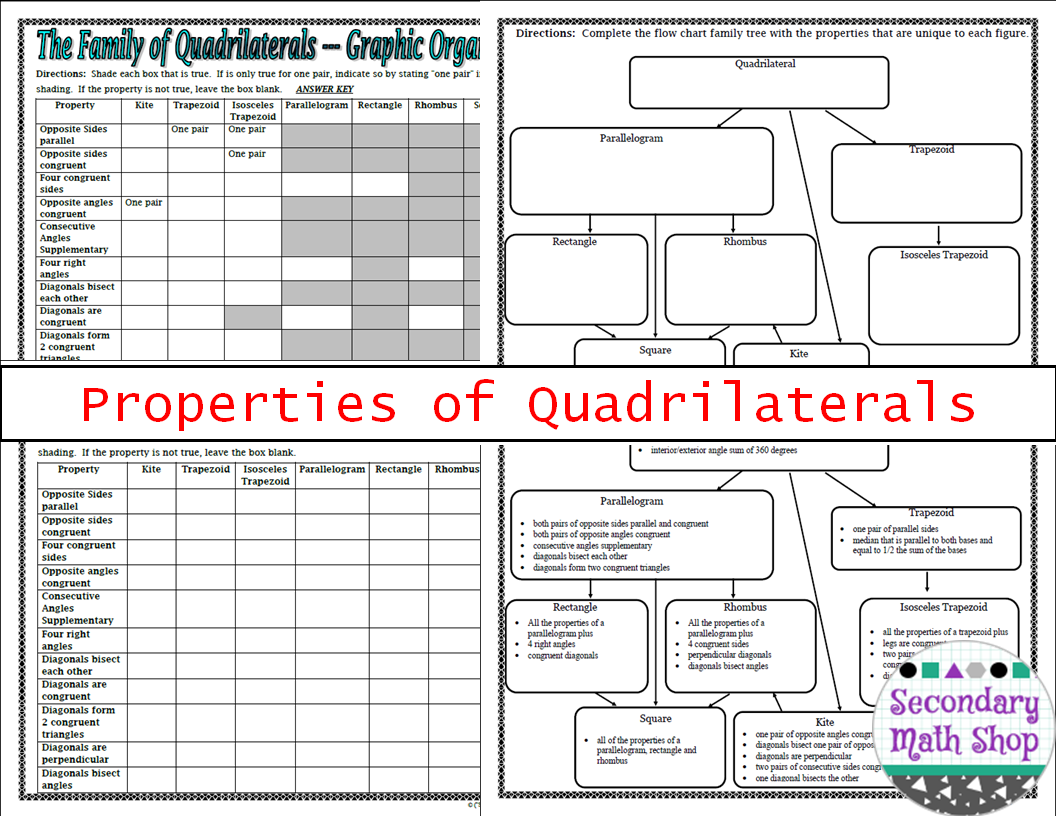 |
| Quadrilaterals |
2) Graphic organizers help students to organize the
information in such a way as to highlight and summarize the important concepts. As much as I would love to believe that every
word that comes out of my mouth when I am teaching a lesson is pure gold, this
is not true. Realistically some of it is
just filler, examples or ways of explaining a concept multiple ways to help
students understand. It is not always
the meat of a topic but the sides dishes as well! Graphic organizers help students to cut
through the extra information to get to the foundational parts. For example, when I teach my unit on Right
Triangles and Trigonometry, I give my students a set of graphic organizers at
the beginning of the unit that they can fill-in as we go along. These organizers are designed for students to
include all of the formulas and an example of solving or applying that formula
since this is truly the crucial part of the unit.

3) Graphic organizers appeal to visual learners. In addition to helping most students see the
relationships among topics, graphic organizers can help some students just
simply see that information. For some
students, notes are just words on paper that they need to try to decode, often
without success. Graphic organizers can
help them to make sense of those ideas and translate the information into a
medium that speaks to them. For example,
when we do our unit on Circles, a unit that is extremely visual, my students
who learn best visually are known to color coat the parts and constantly refer
back to the organizers as they solve problems because they really help them to
see, understand and be able to apply the concepts.
 |
| Circles |
Whatever the reason or
method, the course you teach or the level you teach at, I highly recommend implementing
graphic organizers into your classes.
Not only will your students benefit, but you will too! I have other graphic organizers than the ones listed, please click here to see them all!
No comments:
Post a Comment